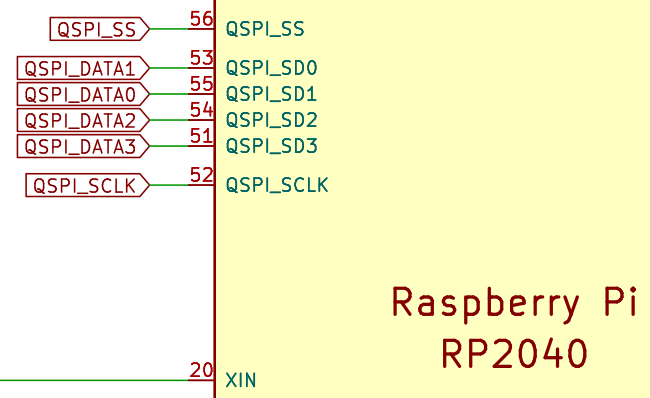
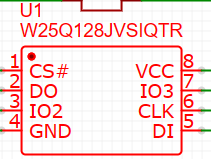
I am trying to debug a custom rp2040b2 board with Winbond W25Q128JVSQ with the debug probe and am following the Raspberry Pi Debug Probe tutorial. The board is intended to be similar to a Pico (for easier firmware programming), but with features specific to connecting with a keyboard matrix.
When I try and upload my first program to my custom board I get the following error. It is my suspicion that the W25Q128JVSQ is not being detected properly. After looking through the code, it appears to support the W25Q128JV. I also verified all the schematics and as expected the connection to the flash chip is standard serial SPI NOR FLASH wired to the rp2040. Any help would be appreciated!
sudo openocd -f interface/cmsis-dap.cfg -f target/rp2040.cfg -c "adapter speed 5000" -c "program hello_serial.elf verify reset exit"
Result
Open On-Chip Debugger 0.12.0-g4d87f6d (2023-12-10-10:40)
Licensed under GNU GPL v2
For bug reports, read
    http://openocd.org/doc/doxygen/bugs.html
Info : Hardware thread awareness created
Info : Hardware thread awareness created
adapter speed: 5000 kHz

Info : Using CMSIS-DAPv2 interface with VID:PID=0x2e8a:0x000c, serial=E6616407E33E4729
Info : CMSIS-DAP: SWD supported
Info : CMSIS-DAP: Atomic commands supported
Info : CMSIS-DAP: Test domain timer supported
Info : CMSIS-DAP: FW Version = 2.0.0
Info : CMSIS-DAP: Interface Initialised (SWD)
Info : SWCLK/TCK = 0 SWDIO/TMS = 0 TDI = 0 TDO = 0 nTRST = 0 nRESET = 0
Info : CMSIS-DAP: Interface ready
Info : clock speed 5000 kHz
Info : SWD DPIDR 0x0bc12477, DLPIDR 0x00000001
Info : SWD DPIDR 0x0bc12477, DLPIDR 0x10000001
Info : [rp2040.core0] Cortex-M0+ r0p1 processor detected
Info : [rp2040.core0] target has 4 breakpoints, 2 watchpoints
Info : [rp2040.core1] Cortex-M0+ r0p1 processor detected
Info : [rp2040.core1] target has 4 breakpoints, 2 watchpoints
Info : starting gdb server for rp2040.core0 on 3333
Info : Listening on port 3333 for gdb connections
[rp2040.core0] halted due to debug-request, current mode: Thread
xPSR: 0xf1000000 pc: 0x000000ea msp: 0x20041f00
[rp2040.core1] halted due to debug-request, current mode: Thread
xPSR: 0xf1000000 pc: 0x000000ea msp: 0x20041f00
** Programming Started **
Error: Unknown flash device (ID 0x00ffffff)
Error: auto_probe failed
** Programming Failed **
shutdown command invoked


