I need to do some stress testing on some raspberry pi's and I'm trying to setup monitoring tools to detect which resource is the bottleneck in various scenarios.
I'd like to monitor network, disk, memory & cpu.
RPI-monitor seems to do disk, memory & cpu out of the box but requires some configuration to monitor the network.
But it's unclear from the doc exactly how to display bandwidth utilization. Currently I'm using wifi but I'd like to be able to experiment with ethernet cable as well.
The rpimonitord man page mentions /etc/rpimonitor/data.conf.
This file includes others like
- include=/etc/rpimonitor/template/network.conf
- include=/etc/rpimonitor/template/wlan.conf
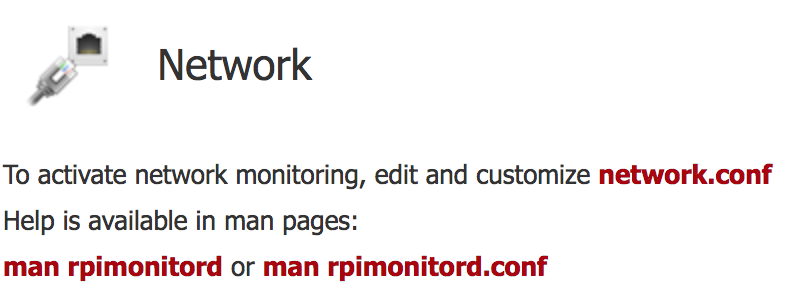
network.conf seems to be for ethernet. This is displayed on the monitoring web page:
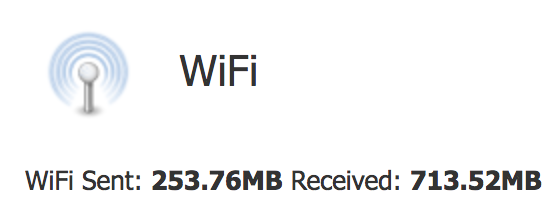
wlan.conf seems to be for wifi. including wlan.conf only displays bytes in and out like so.
I found a sample wlan.conf file that might meet my needs here but it doesn't the display is the same.
########################################################################
# Graph WLAN
########################################################################

dynamic.17.name=wifi_received
dynamic.17.source=/sys/class/net/wlan0/statistics/rx_bytes
dynamic.17.regexp=(.*)
dynamic.17.postprocess=$1*-1
dynamic.17.rrd=DERIVE

dynamic.18.name=wifi_send
dynamic.18.source=/sys/class/net/wlan0/statistics/tx_bytes
dynamic.18.regexp=(.*)
dynamic.18.postprocess=
dynamic.18.rrd=DERIVE

web.status.1.content.9.name=WiFi
web.status.1.content.9.icon=wifi.png
web.status.1.content.9.line.1="WiFi Sent: <b>"+KMG(data.wifi_send)+"<i class='icon-arrow-up'></i></b> Received: <b>"+KMG(Math.abs(data.wifi_received)) + "<i class='icon-arrow-down'></i></b>"

web.statistics.1.content.9.name=WiFi
web.statistics.1.content.9.graph.1=wifi_send
web.statistics.1.content.9.graph.2=wifi_received
web.statistics.1.content.9.ds_graph_options.net_send.label=Upload bandwidth (bits)
web.statistics.1.content.9.ds_graph_options.net_send.lines={ fill: true }
web.statistics.1.content.9.ds_graph_options.net_send.color="#FF7777"
web.statistics.1.content.9.ds_graph_options.net_received.label=Download bandwidth (bits)
web.statistics.1.content.9.ds_graph_options.net_received.lines={ fill: true }
web.statistics.1.content.9.ds_graph_options.net_received.color="#77FF77"
Ultimately I just want an accurate measure of bandwidth utilization. If I can get this tool to display that, that would be great. If there is another tool which can be used, that would be great too.


