1

I'm setting up a set of 5 Rpi 3As and an RPi4 as a "master" for the fleet.

I want to monitor a few things on the Pis (cpu/ram/disk and some REST endpoints) and access a web UI to see the state of the entire fleet.

The pi4 has an attached SSD for storage, so SD wear shouldn't be a problem.

Do you guys know about a simple solution for monitoring sub-10 devices with a nice web UI and lightweight collectors?

I know about the TICK stack but InfluxDB seems to baloon quickly in memory, and I don't really need historical data. Also, I feel that there are too many gears turning (Telgraf, Influx, Capacitor/Grafana) and the monitoring is based on my own alerts.

Also, there's always the good ol' RRD & CollectD, but there's not alerting in there, just fancy graphs.

Any idea about how to run a monitoring daemon on the master, query a few data on the nodes (and the master), and have a bit of alerting? I heard about Zabbix and I'm wondering if it is worth the look?

Thanks in advance

1
  • Mosquito MQTT messages to Node Red ?
    – CoderMike
    Commented Jan 2, 2020 at 16:58

2 Answers 2

1

If you are finding a monitoring solution, SNMP is the answer. In this protocol, we can send even real-time system components' status to an SNMP server.
In this way, at first, you must enable SNMP on RPis then install the SNMP server for getting other devices information.
The SNMP server is the system that gets RPis data and shows you on a web page. It can be one of the RPis or another computer or a host. Anyway, follow the structures.

1. Enable Raspberry Pi SNMP:

1-1. Update repository and install packages:

sudo apt-get install snmp snmpd snmp-mibs-downloader  

1-2. Uncomment agentAddress udp:161,udp6:[::1]:161 to access all host trying SNMP request and uncomment/add rwcommunity public to read/write SNMP values (OIDs):

sudo nano /etc/snmp/snmpd.conf

1-3. Restart the service:

sudo service snmpd restart  

1-4. Test the configurations:

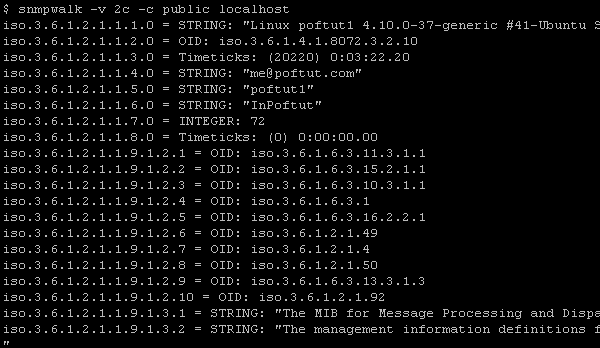
snmpwalk -Os -c public -v 1 127.0.0.1

In addition, you can test the RPi by another one with snmpwalk -Os -c public -v 1 IPADDRESS.
You will see something like the picture below.

the result of a snmpwalk command

2. Monitoring software:

In this part, you must install the best one for your own OS. As an example, if you want to monitor RPis on Windows OS, PRTG or on Linux, Zabbix (a bit hard to install and config, Node-Red can be better) can be a great choice. Check this link - Best Open Source Monitoring Software out.

All in all, add RPi's IP address to the software for fetching information.


SNMP protocol has another feature as spontaneous sending information which is named SNMP-Trap. It means that the devices send their status by themselves. For example, if the CPU rate reached 95%, an SNMP-Trap goes to be sent.

0

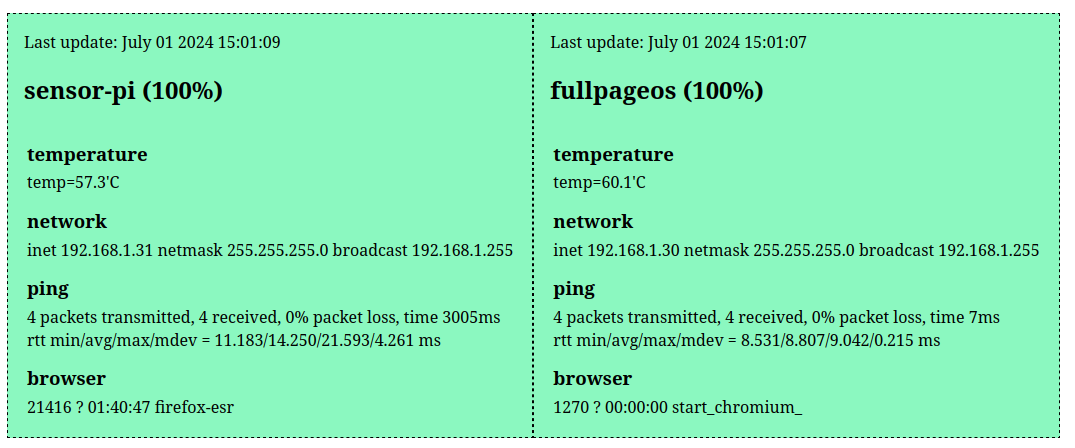
I have created an open source solution - a very simple monitoring with a dashboard: https://ambience.sk/raspberry-pi-monitoring-and-dashboard/

It has some basic metrics included but it's easily extensible:

  • hostname
  • CPU temperature
  • network IP address
  • ping results
  • running browser (only Firefox and Chromium are checked at the moment)
  • optionally also a screenshot of current graphical X display (using scrot)

It uses Python script for client and PHP on a server to receive data and display dashboard.

enter image description here

1
  • Your answer could be improved with additional supporting information. Please edit to add further details, such as citations or documentation, so that others can confirm that your answer is correct. You can find more information on how to write good answers in the help center.
    – Community Bot
    Commented Jul 4 at 7:33

Your Answer

By clicking “Post Your Answer”, you agree to our terms of service and acknowledge you have read our privacy policy.

Not the answer you're looking for? Browse other questions tagged or ask your own question.